SPEEDis a comprehensive single-cell pan-species atlas of hundreds of species and diseases, studying development and disease from an ecological and evolutionary perspective. This resource allows to interactively explore the single-cell atlases of over 127 speciesand 85 diseasesobtained using single-cell RNA sequencing (scRNA-seq). The atlas can be accessed here: http://speedatlas.net.
Pan module
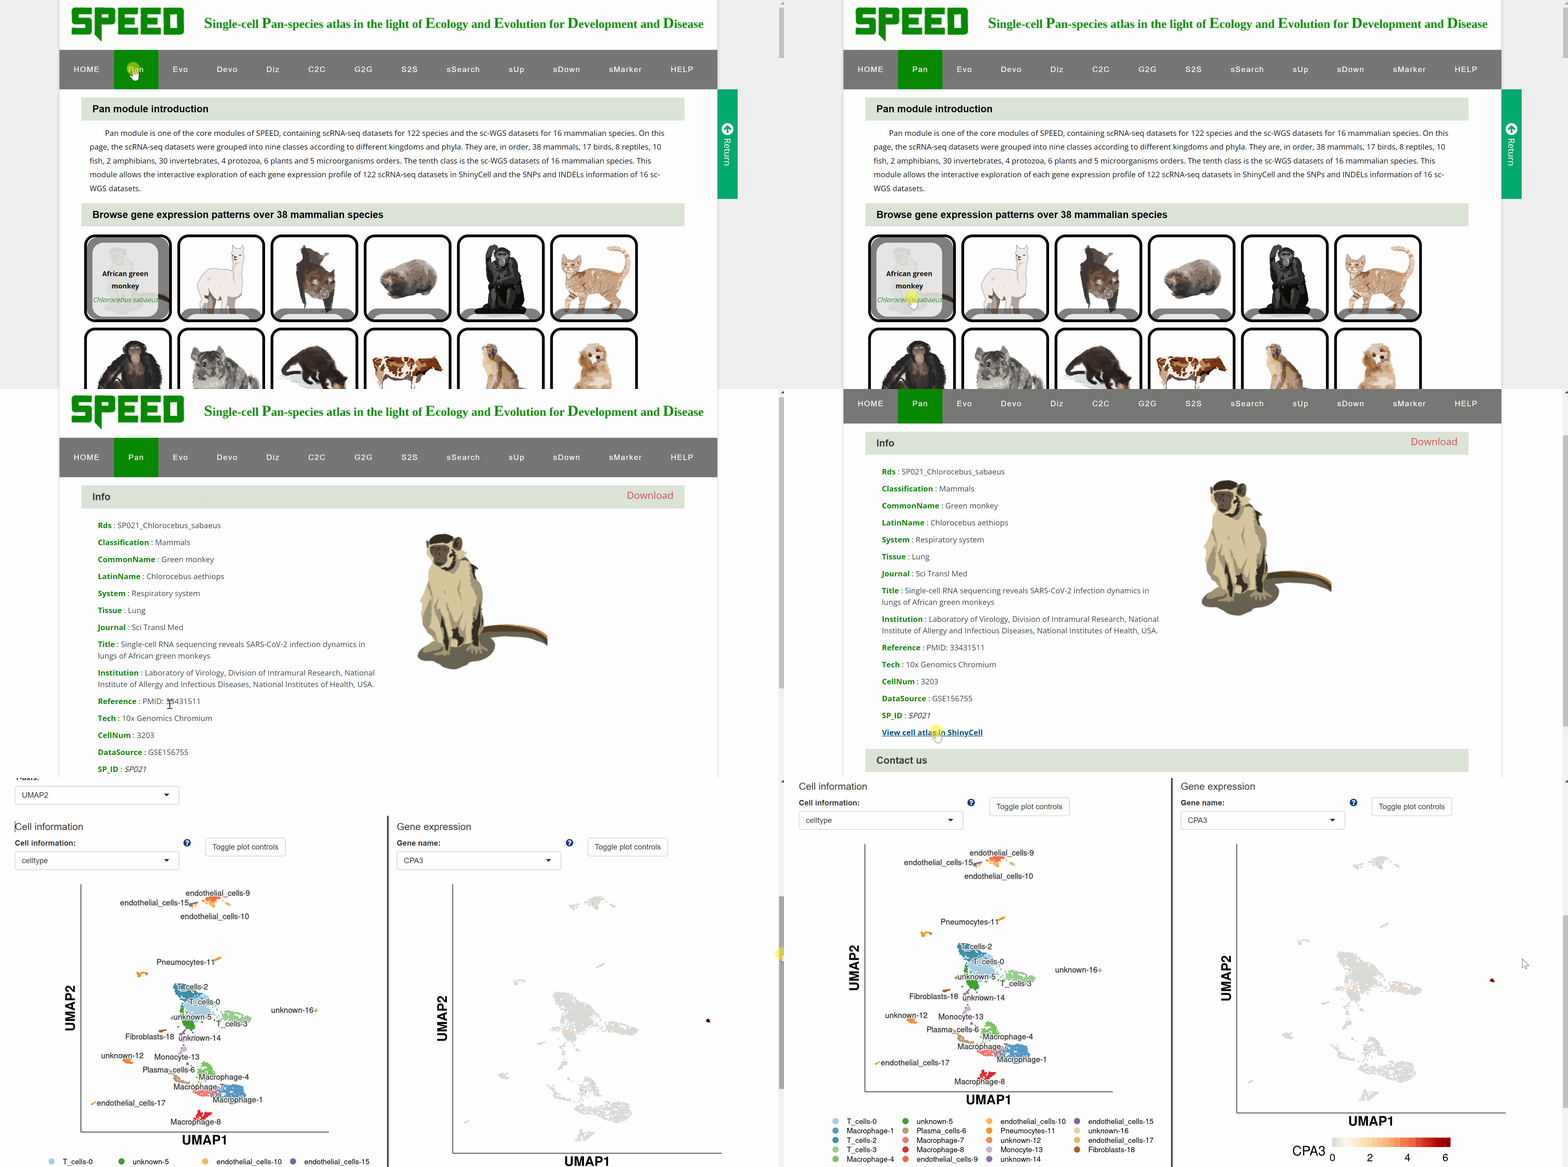
Within Pan module, we group scRNA-seq data for 122species and sc-WGS data for 16mammalian species. The scRNA-seq data for 122 species are presented in a total of nine categories according to different kingdoms and phyla, with vertebrates further subdivided into five categories: mammals, birds, reptiles, fish and amphibians. Each box with an image represents one species, with the species name in black fontand the Latin name in green italics. Users can browse the atlas by hitting any two names in the boxes to open the specie profile. On the profile page, a link within each “Rds” of the “Brower Dataset” takes users to a new tab page with background information on the dataset. Continue to click “View cell atlas in ShinyCell” in red font to explore cell information, gene expression pattern and visualizations of single-cell data in ShinyCell. All options could be customized in the drop-down box for comparison. The sc-WGS data for 16 mammalian species are presented at the bottom of Pan module. As with accessing the scRNA-seq data, by clicking on the genetic or Latin name of the species in the box, information on sc-WGS datasets for the specie is shown in a new tab. The SNPs and INDELs for sc-WGS datasets can then be accessed by clicking on links “View SNP information” and “View Indel information” in red font.
Evo module
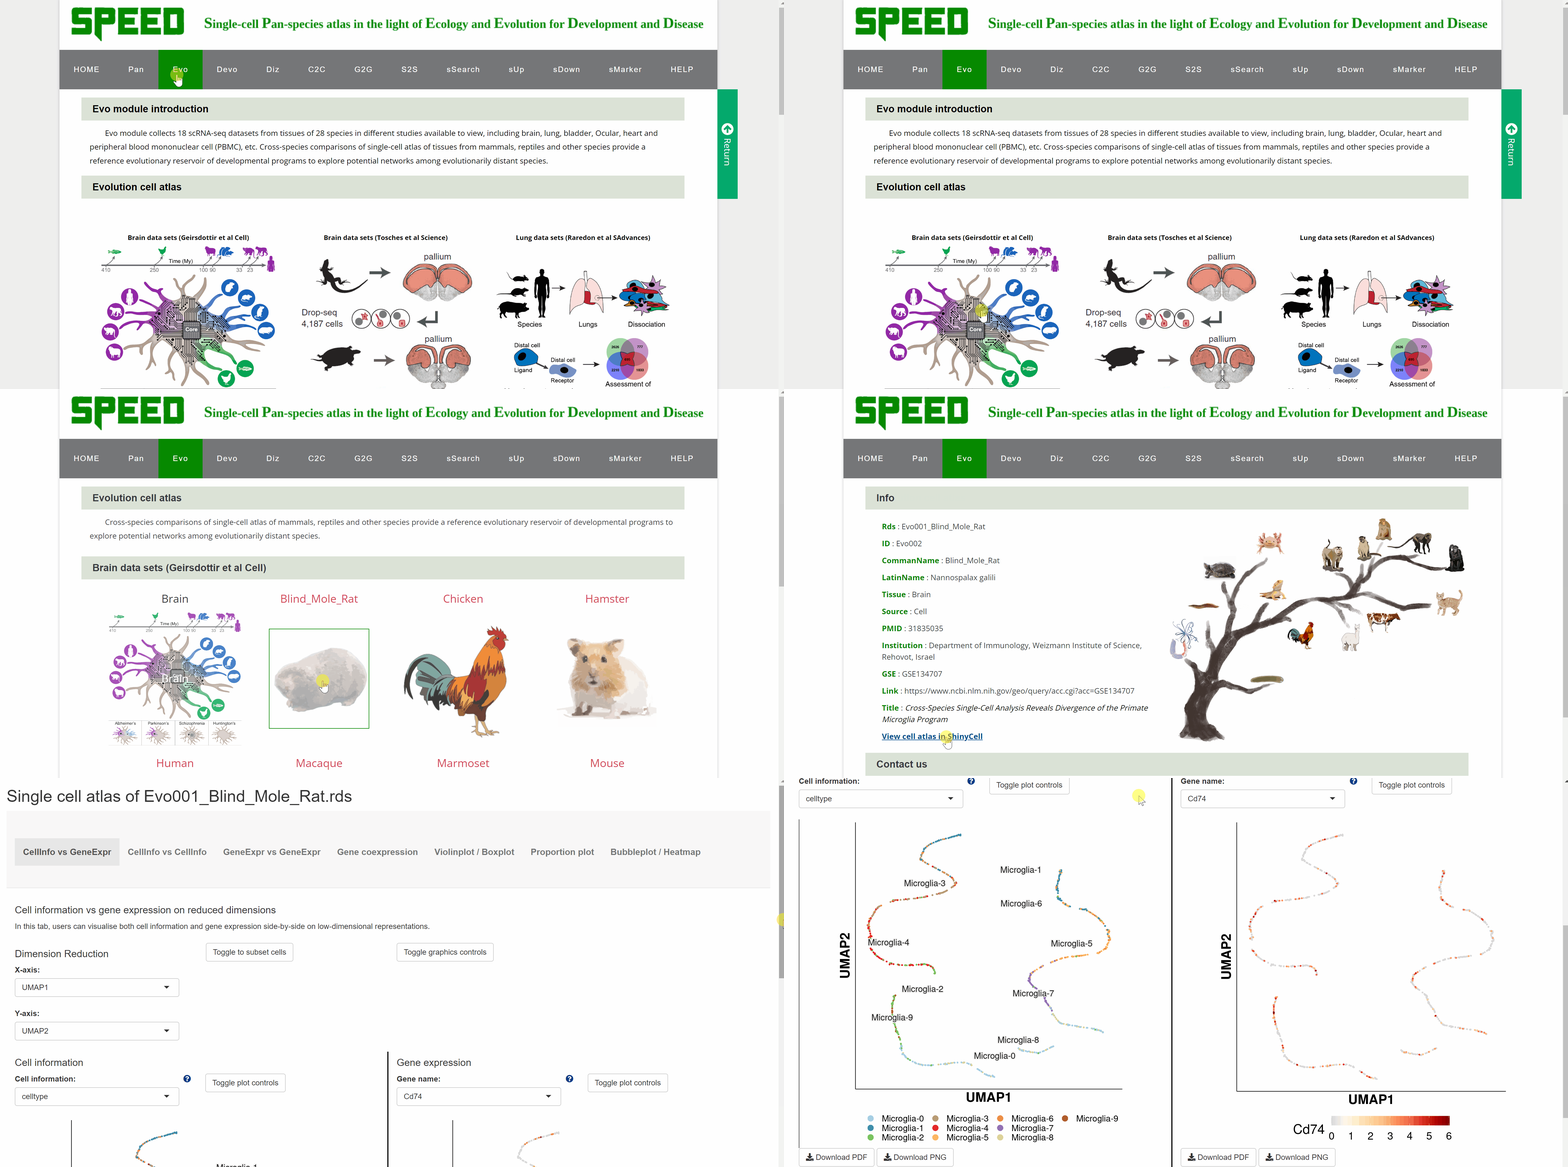
Evo module contains 18 datasetsfrom tissues of 28 speciesin different studies, including brain, lung, heart, bladder, ocular compartment, eye, bone marrow, intestine, kidney, liver, embryo, and peripheral blood mononuclear cell (PBMC). The tissue dataset is accessed by clicking on the dataset images and the current page switches to a new page showing images of all species in the dataset. Continue to click on the species image or names to a specific profile page with detailed information. Click on the link button in red font “View cell atlas in ShinyCell” and the scRNA-seq atlas is available in ShinyCell.
Devo module
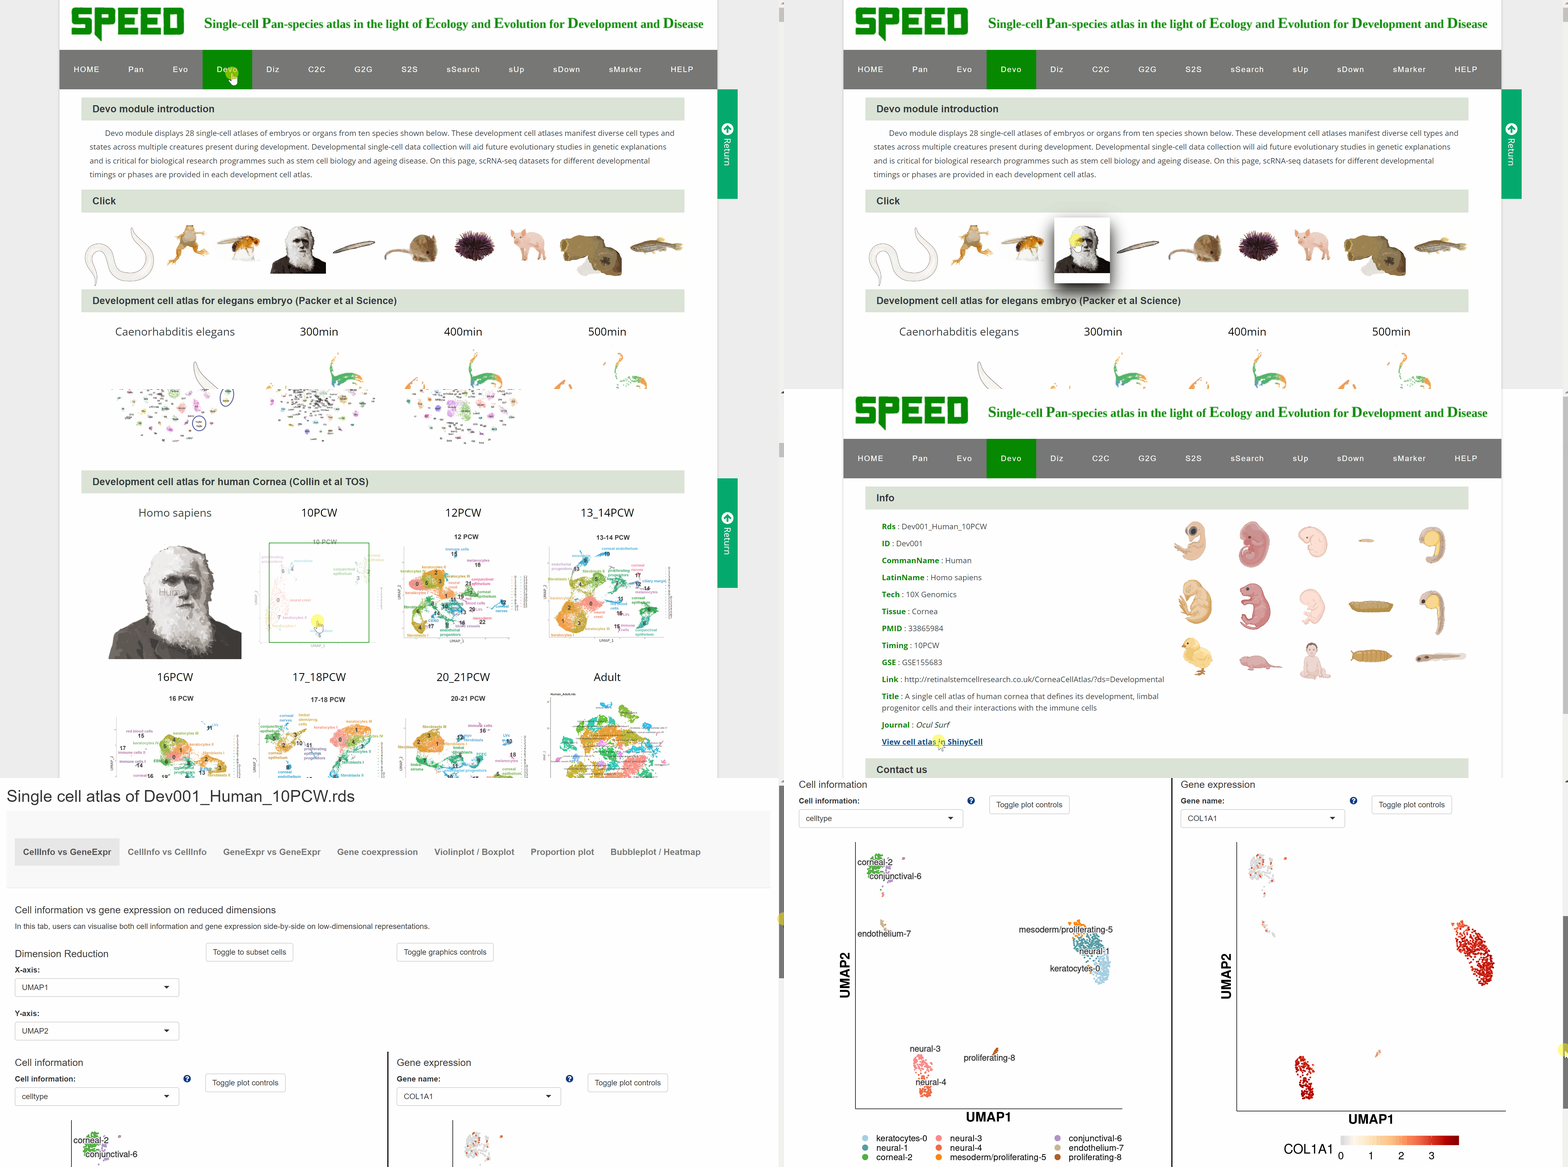
Devo module includes 28 single-cell atlasesof brain, cornea, testes, skin, intestine, mammary gland, male gonad, female gonad, heart, kidney, liver, lung, pancreas, stomach, embryos, and pacific purple sea urchin from ten species. Point to an image of any of ten species and click on it, the page will go to the data category of that species. Then select the different timings or developmental phases by clicking on the name or pictures of the species to get a new page that shows the details of the dataset. Continue to click on the link button in red font “View cell atlas in ShinyCell” to view the scRNA-seq atlas.
Diz module
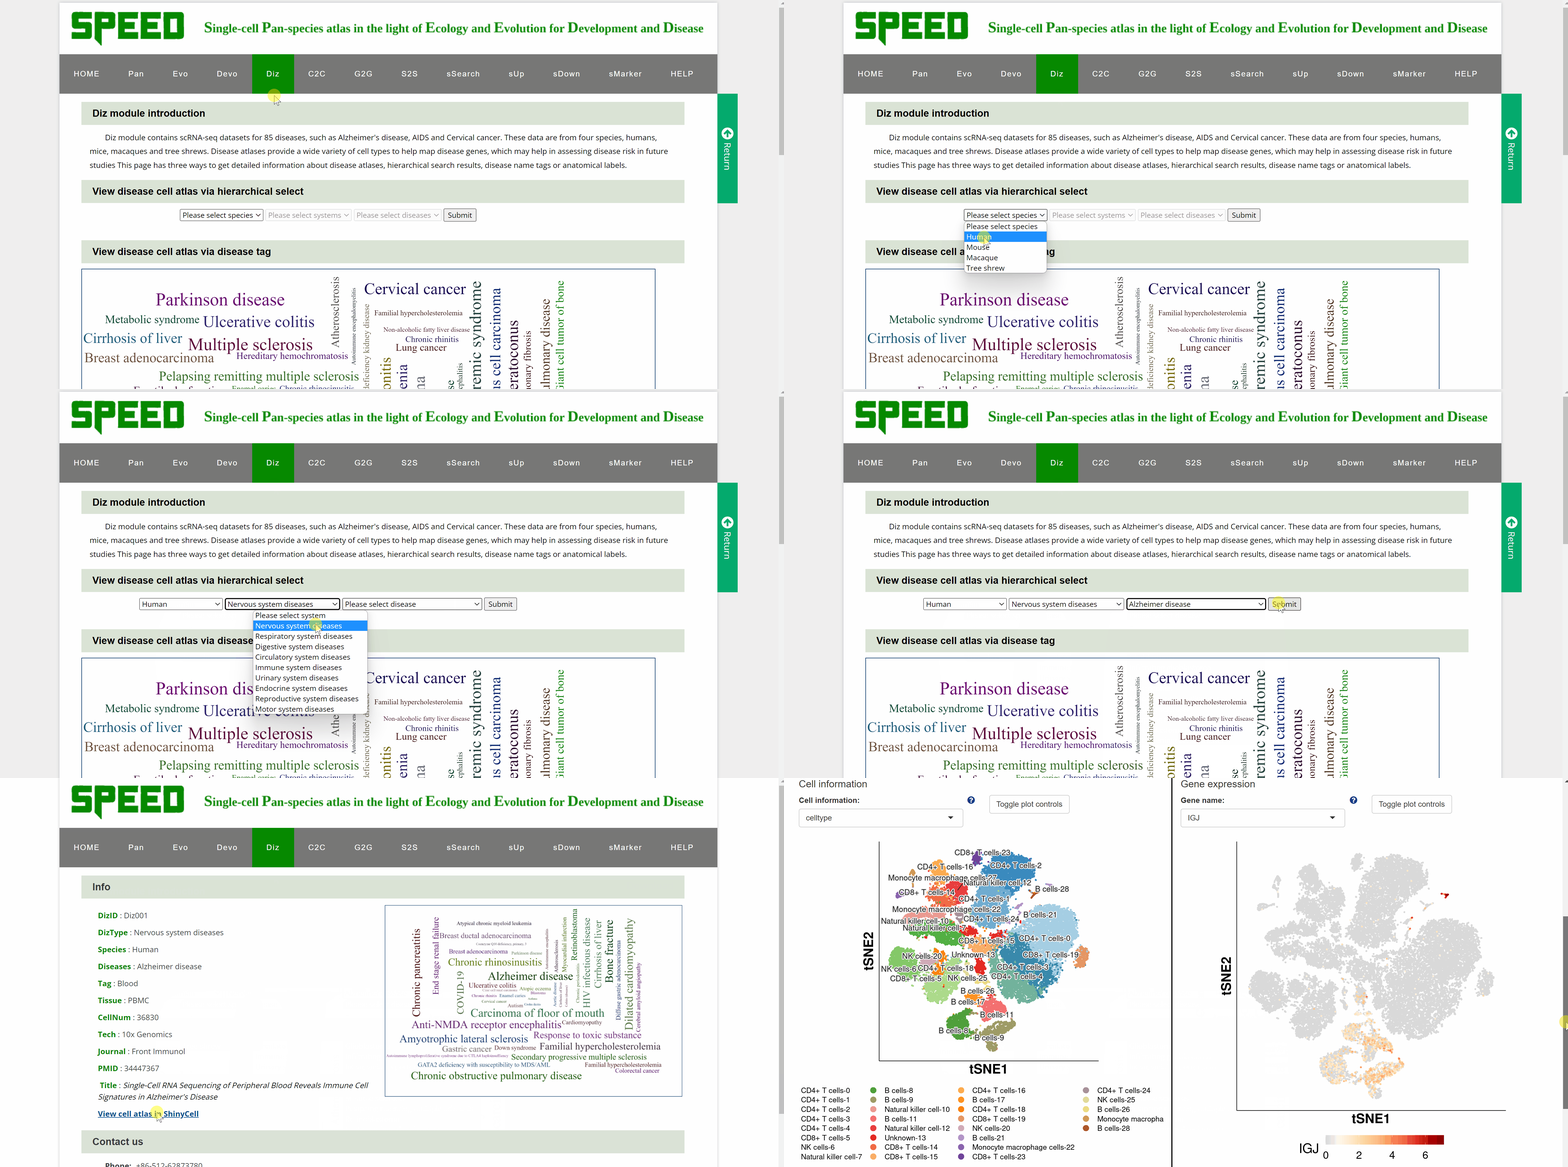
ScRNA-seq datasets from humans, mice, macaques and tree shrews for 85diseases including neurological, respiratory, digestive, cardiovascular, immunological, urinary, endocrinological, reproductive, and motor system diseases are collected in Diz module. Diz module provides four approaches to retrieving scRNA-seq atlas for different diseases. The first one is to select a disease directly from the drop-down box sorted alphabetically by disease name. The second way is by species-system-disease hierarchical selection, where you select the species from which the disease originated, which system the disease is in and the name of the disease. The third method of selection is by clicking on disease name tags in the word cloud, which carries a link to the dataset page. The last approach to viewing the disease cell atlas is by anatomical labels on the human and mouse anatomies, with a link on each label directing to the dataset for the particular body part disease. Once a disease is selected, a new tab will appear with the basic information about the dataset. By clicking on the link button in the column of “DizlD”, users can get more detailed information on disease-related scRNA-seq atlas on another profile page. Continue to view cell information, gene expression pattern and visualizations of disease single-cell data in ShinyCell via the link button “View cell atlas in ShinyCell” in red font.
C2C module
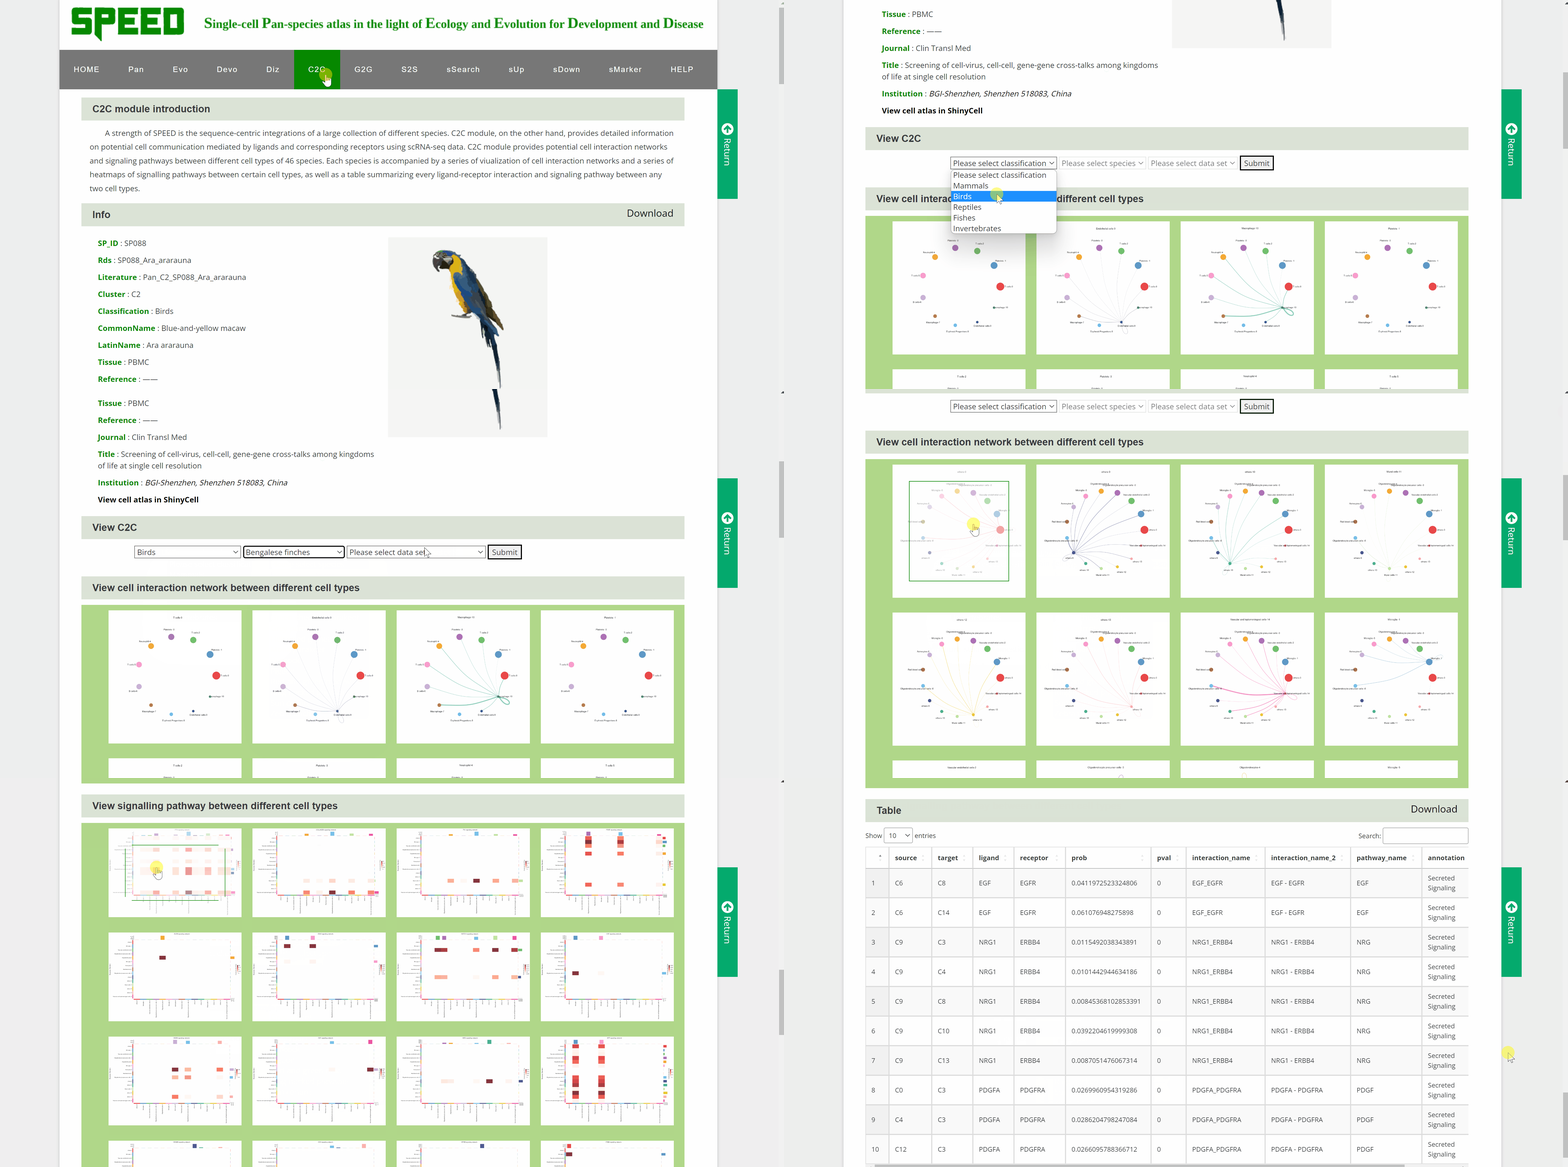
C2C module predicts potential cell communication mediated by ligands and corresponding receptors between different cell types of 46 speciesin the SPEED database. How to view potential cell communication for each species in C2C module? Simply pick one species by hierarchically selecting its classification, species name and dataset in the “View C2C” column and click the “Submit” button. The interface will then redirect to the cell analysis interface for that species. Data source information is provided in the "Info" column, and details of the single-cell atlas can be viewed in ShinyCell by clicking “View cell atlas in ShinyCell” in black font. The “View cell interaction network between different cell types” catalogue is a visualization of the interactions of the main cell types included in a series of images. In each image, lines between cell types from light to dark represent weak to strong connections, and blanks represent no connections. The last image is a summary of all the previous cell interaction networks. The “View signalling pathway between different cell types” catalogue displays signalling pathways between certain cell types included in a range of heatmaps. Click on each heatmap to view the signaling pathway network among particular cell types. Next, a table at the bottom summarising every ligand-receptor interaction and related signaling pathway between all cell types. Just search for the keywords in the box and get customised cellular information!
G2G module
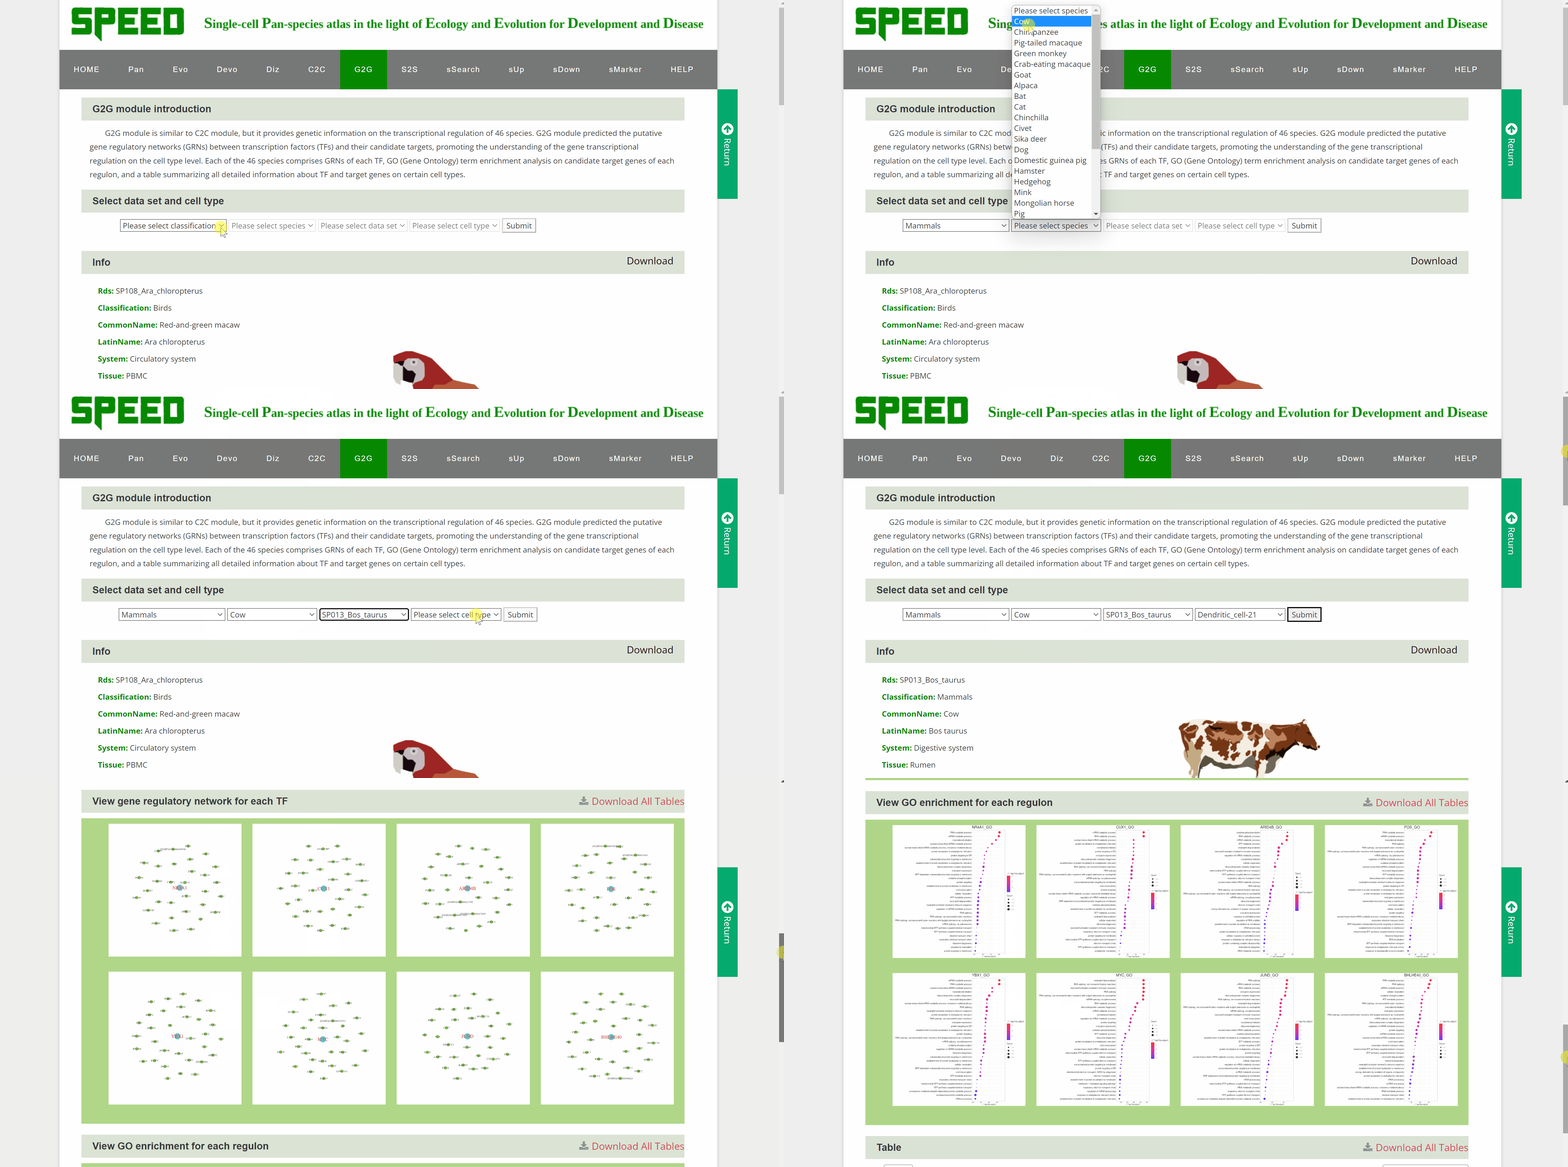
G2G module is similar to the C2C module but provides genetic information on the transcriptional regulation of 46 species. Once the query species is identified by hierarchically selecting its classification, species name, dataset and cell type in the “View G2G” column and clicking the “Submit” button, the genetic information on the species will be shown in the "Info" column. The details of the single-cell atlas of the species can also be viewed in ShinyCell by clicking “View cell atlas in ShinyCell” in black font. The “View gene regulatory network for each TF” catalogue includes a series of pictures of gene regulatory networks (GRNs) for transcription factors (TFs) of the species. The TF name in red font is located in the hub of GRNs, around which candidate target genes are scattered. The “View GO enrichment for each regulon” catalogue performs Gene Ontology (GO) term enrichment analysis on candidate target genes of each regulon of the species. The top 32 terms for each regulon are shown in this catalogue. Finally, a table also summaries all genes in each cell of the species. Users query the detailed information on TF and target genes on certain cell types by the “Search” button.
S2S module
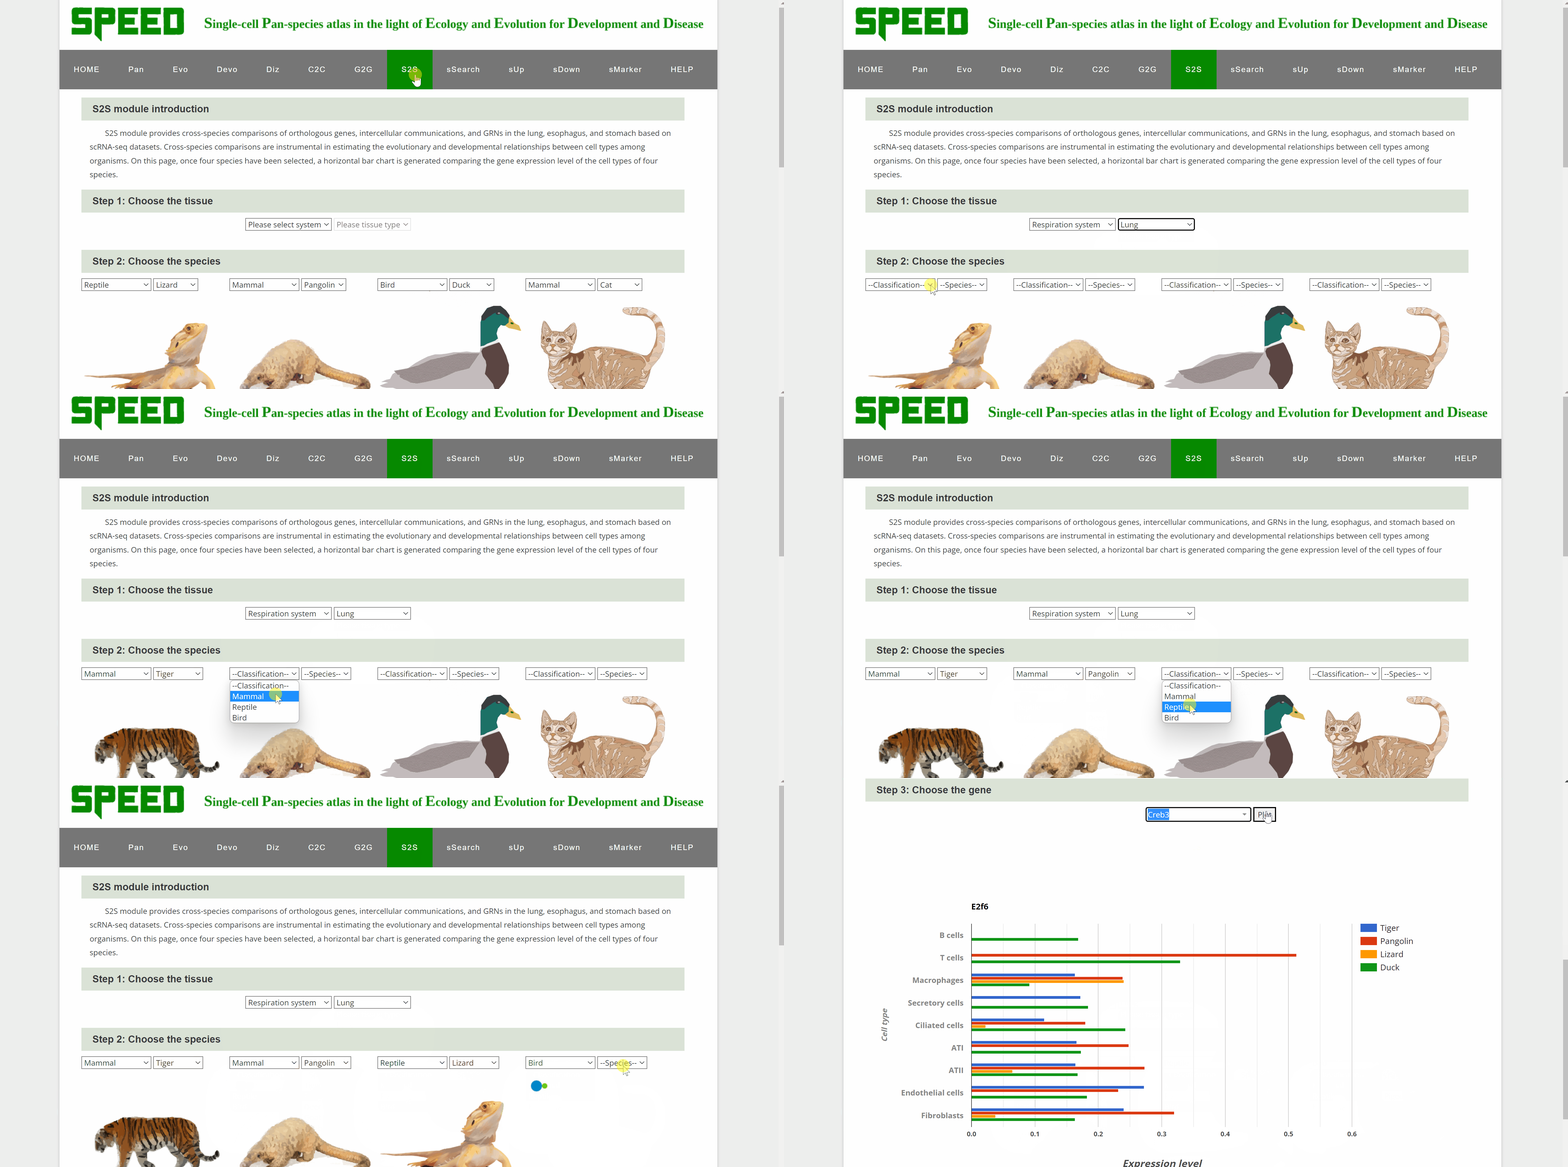
S2S module allows cross-species comparison of expression patterns of transcription factor encoding genes up to four species in our atlas. Step one, select the system and tissue under “Step 1: Choose the tissue” item. Next, select each of the four species from the list in the "Step 2: Select Species" item below. Once select a gene and click on the “Plot” button under “Step 3: Choose the gene” item, a horizontal bar chart comparing the expression level of TFs across the cell types of selected species is generated.
sSearch module
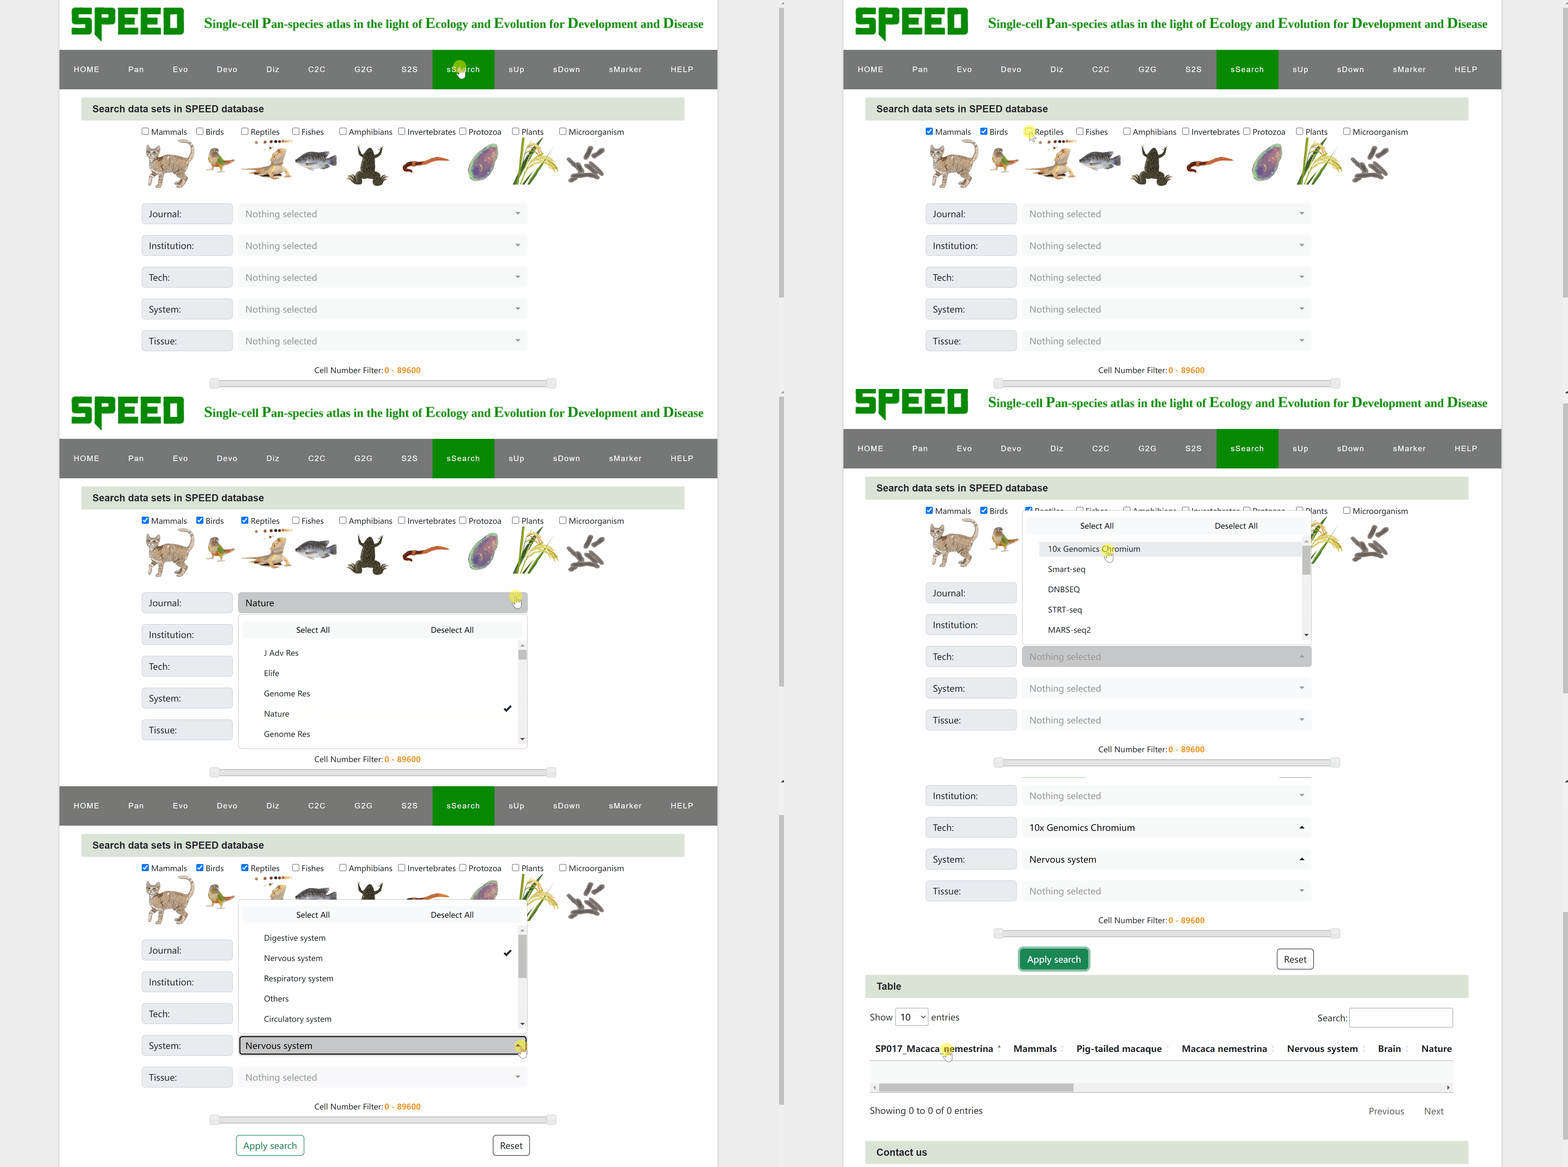
In sSearch module, users can choose individually or in combination the category of the species, the journal name where the dataset was published, the institution of the corresponding author, or the sequencing technology, system and tissue of the single cell, with the option to set the number of cells. After clicking on the “Apply search” button, search results will be displayed in the table below. The selection can be reset at any time by clicking on the “Reset” button next to the “Apply search” button. The selection of each category can also be reset individually via the “Select All” or “Deselect All” buttons. Continue to click on the name of RDS files to browse for the information on each dataset. The page will be redirected to a new profile page with the data source information for the species, then click on “View cell atlas in ShinyCell” in red font to view details of the single-cell atlas in ShinyCell.
sUp module
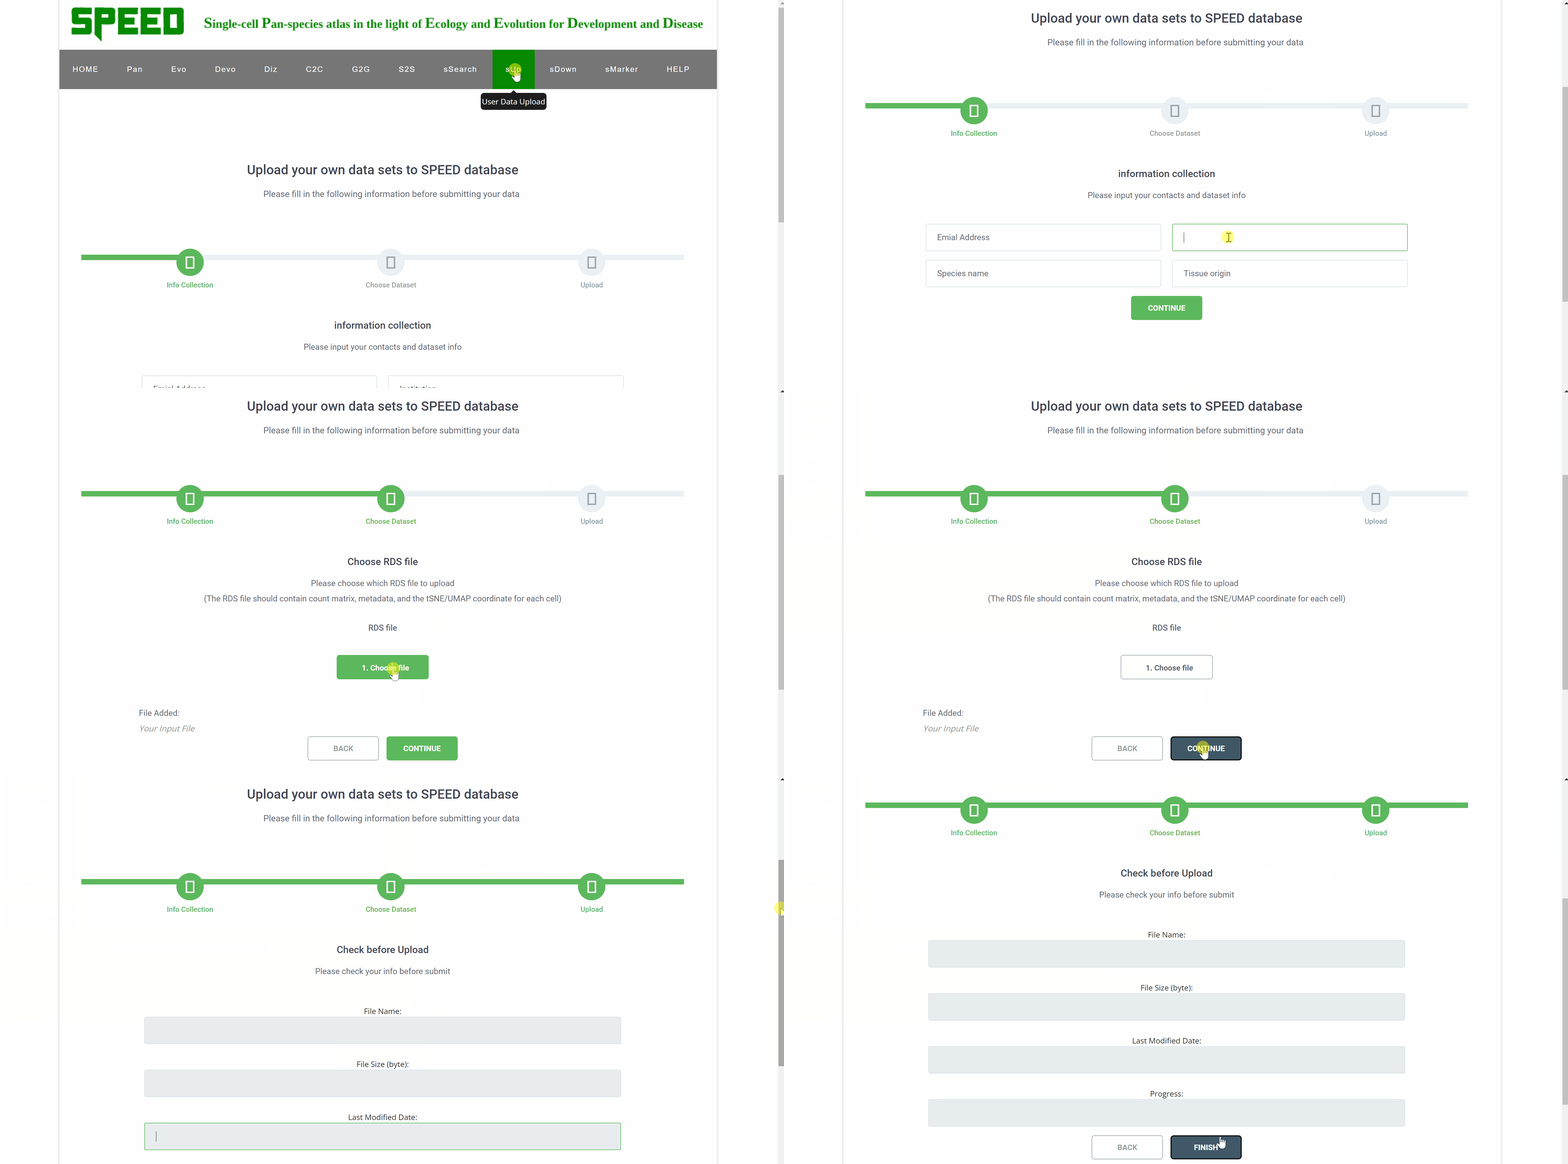
Upload your single-cell dataset to SPEED in three simple step. First, provide your email address, institution, species name, and tissue origin in the“information collection”filed and click "CONTINUE" to proceed to the next step. Then, select the RDS file to be uploaded. The RDS file should contain count matrix, metadata, and the tSNE/UMAP coordinate for each cell. Finally, check your file information before uploading and click on the "FINISH" button.
sDown module
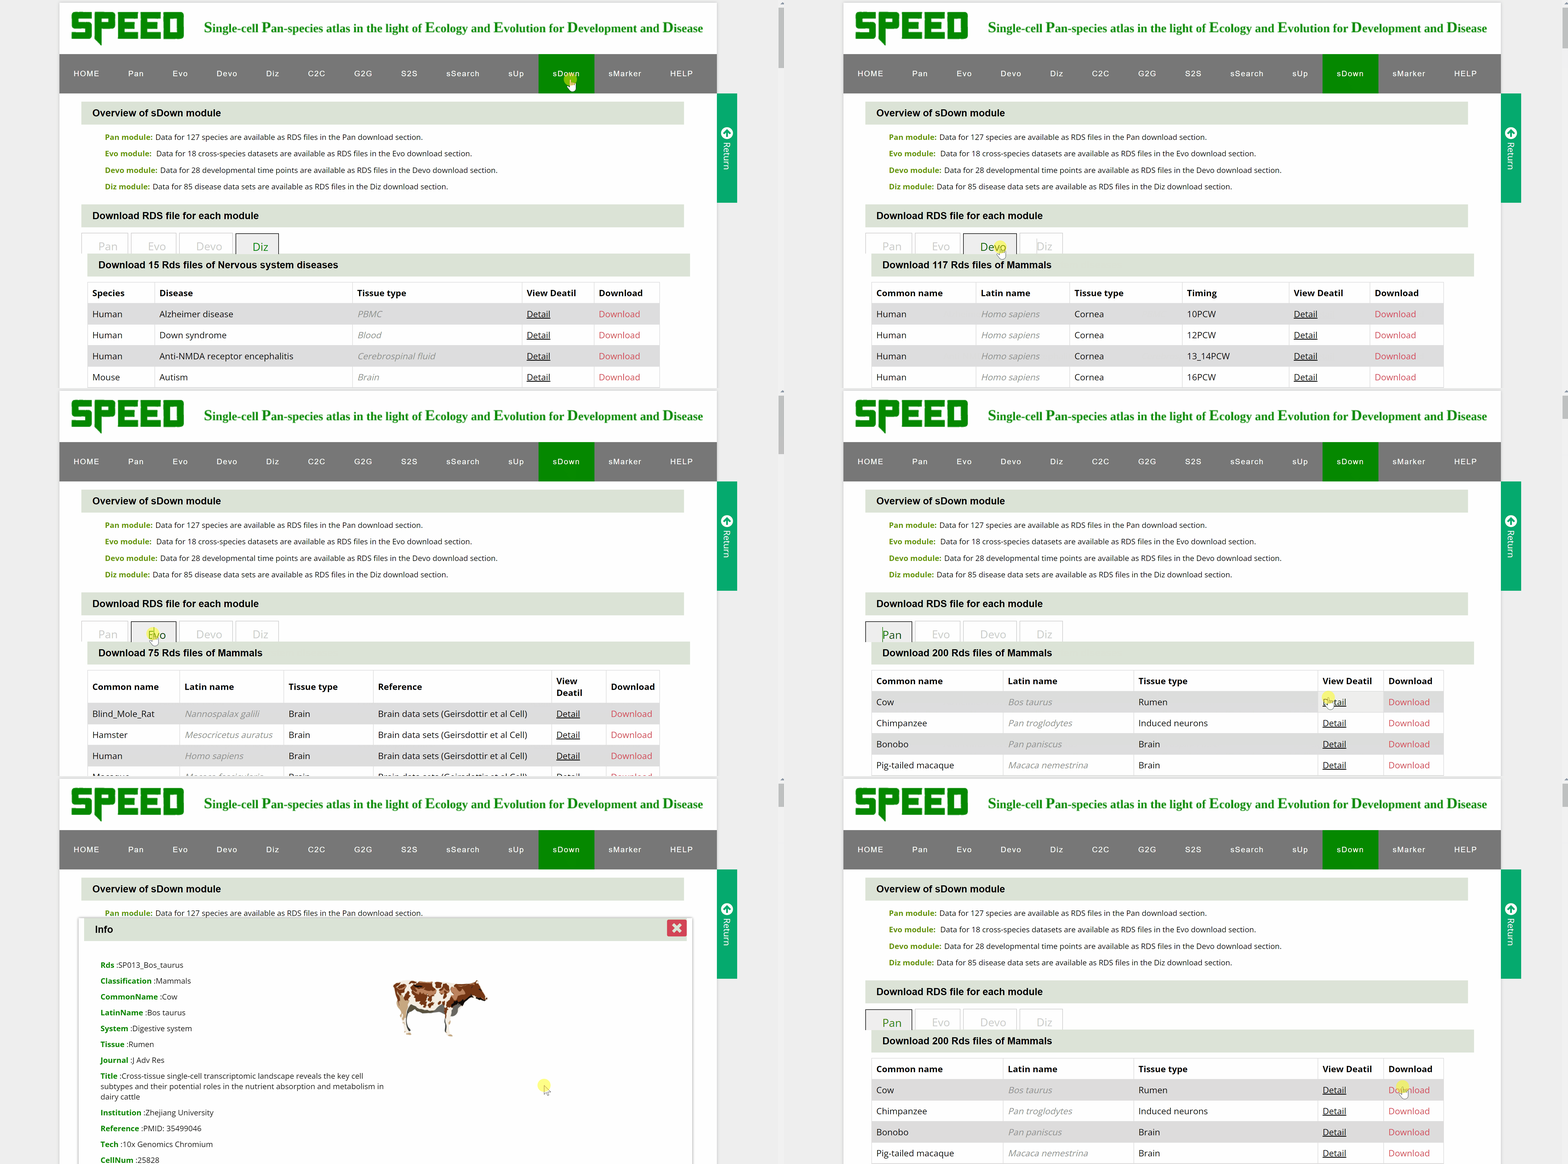
Data for over a hundred different species, cross-species data sets, developmental time points and disease datasets of Pan, Evo, Devo and Diz modules are available as RDS files in the download section. Move your cursor to the data module you wish to download in the “Download RDS file for each module” catalogue and a list of all single cell datasets for the four modules can be found below. Then, move the cursor to the “View Detail” button and a card will be displayed source information for the dataset, which can be closed by clicking on the red cross in the top right corner. The RDS files can be downloaded by clicking on the “Download” button on the information card or the “Download” button behind the dataset.
sMarkers module
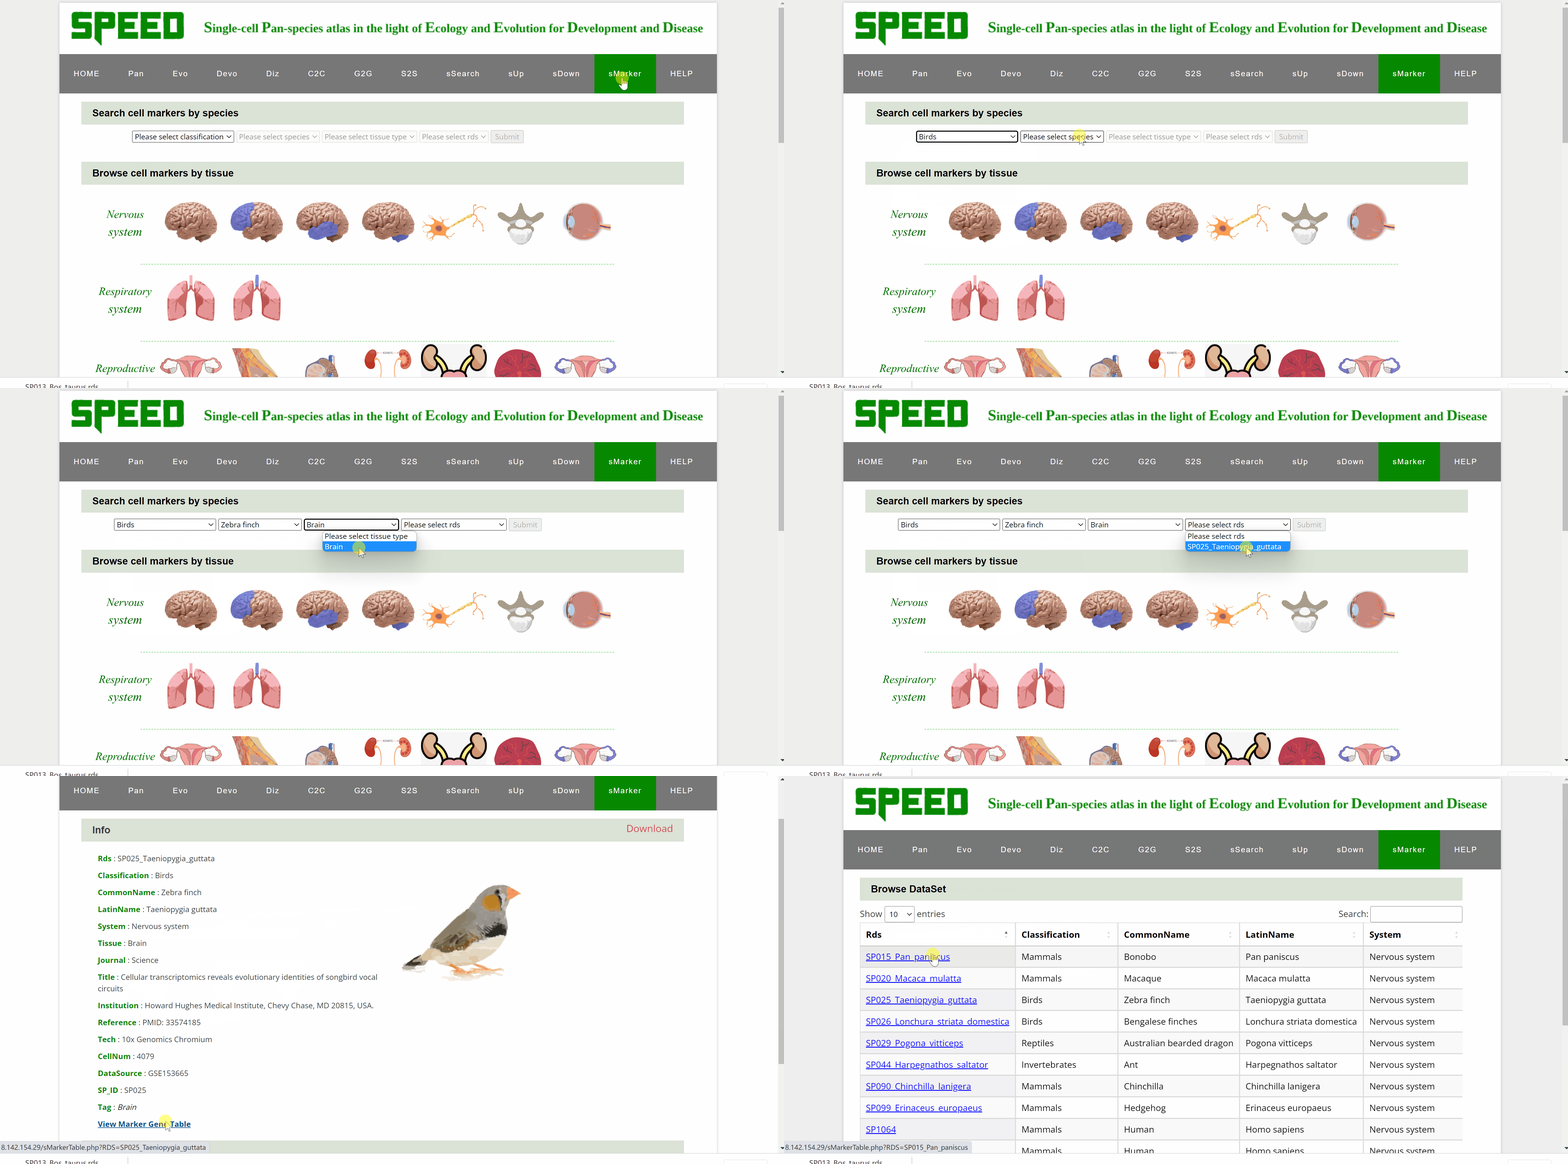
Profess Detlev Arendt first proposed in 2016 that cell types are "evolutionary units" with the potential for independent evolutionary change in his article “The Origin and Evolution of Cell Types”. In single-cell transcriptomic data, cell types are usually identified by cell clustering using established marker genes. sMarkers module groups common marker genes of different species in nice organ systems for easy retrieval for annotation of cell clusters. Each organ system includes cell markers data for a series of different tissue types. On the one hand, users could search cell markers by species by choosing the classification/species/tissue/rds options in the drop-down box under the “Search cell markers by species” item. Once clicked on the “Submit” button, the species information with the link “View Marker Gene Table” in red font will be shown on a new page. Continue to click on the “View Marker Gene Table” button, the current page will be directed to a new page with a marker gene table. Once the marker gene table is opened, any marker gene can be searched by gene or cell type condition. The red “Download Full Table” button in the upper right corner is available for downloading the full table for maker genes. On the other hand, users could also select cell markers by tissue type though clicking on tissue pictures under the following nine system categories. After choosing the picture, users can select the dataset to query based on the information of the dataset under “Browse Data” item. Once open the link in the “Rds” column, the current page will be directed to the same mark genes page mentioned earlier to proceed.
Phone: +86-512-62873780
Fax: +86-512-62873779
Email: cds@ism.pumc.edu.cn
Address: 100 Chongwen Road, Suzhou Industrial Park, Suzhou, China, 215123